Most agencies fall into one of two camps, keeping you in the dark or giving a flood of templatized and mostly meaningless information. We measure web performance, from every platform, in a customized dashboard that you can visit anytime and compare with any timeframe.
Our approach goes beyond just presenting numbers and metrics. We interpret the data, highlight key trends and patterns, and provide actionable recommendations to enhance your digital marketing efforts. Whether it’s identifying areas for improvement, uncovering untapped opportunities, or adjusting your strategies based on performance data, our digital marketing reporting methods are designed to help you make informed decisions. Send us a message today, and find out for yourself why we’re one of the finest digital marketing consultants in Rochester NY.

CEIPAL Tracking
Time Frame: Two Years+ (2018 – Present)
Full-funnel Tracking
For 9 Data Sources
Software used:
Google Analytics, Google Tag Manager, Google Ads, Hubspot, Software Advice, Capterra, GetApp, LinkedIn, Microsoft Excel, TI-89 Operating System
We took Peter Drucker’s words to heart for B2B client CEIPAL; “If you can’t measure it, you can’t improve it.”
Background
CEIPAL, a SaaS platform offering recruiting and workforce management software, became an a(m) client at the end of 2018. As a B2B company, their sales cycle is a bit more complicated than a B2C sale. It’s not about just convincing an individual to purchase a product, instead, it requires multiple touchpoints and interactions before a prospect is converted into a customer. For any B2B SaaS business, simply having Google Analytics installed on the website is not sufficient for proper tracking – and CEIPAL was no exception. This sales process gets complex, making full-funnel tracking and reporting immensely important.
Challenge
Prior to working with a(m), CEIPAL was investing in online advertising on many different platforms and channels. Like any savvy business, they knew that in order to optimize ROI they needed to fully understand what they were investing – where, when, and how much. The problem was, each platform had slightly different metrics and measured a different action in the conversion process (site traffic, email leads, demo sign-ups, ad engagement, etc.). This made unified tracking and reporting difficult; there was no way to get an apples-to-apples comparison across platforms. This led to confusion as to which channel was spending which amount of money and driving which conversions.
This is where a(m) entered the equation.
Our Solution
Defining Relevant KPIs
GENERATING A WEEKLY REPORT TO GAUGE PROGRESS
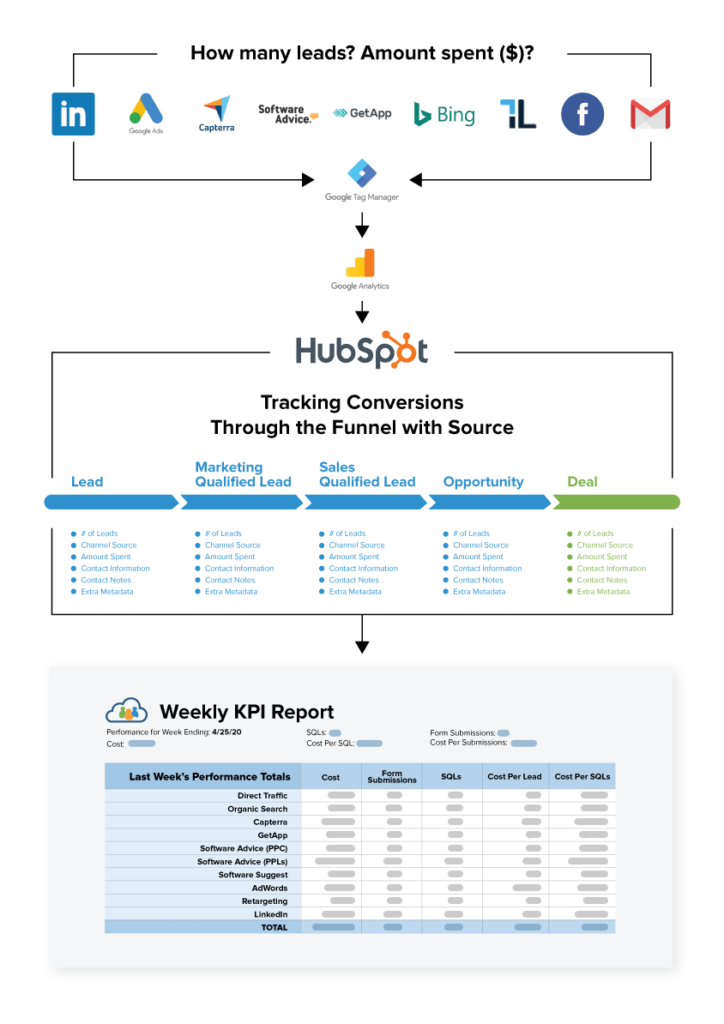
Before changing the setup of their B2B marketing automation funnel, we knew we had to outline what critical business questions needed to be answered on a weekly basis in order to establish a successful tracking and reporting system. By knowing what questions needed to be answered, we would then know which specific metrics would need to be distilled from each platform and correlated.
In collaboration with CEIPAL, a(m) determined that these were the critical weekly questions that CEIPAL needed their reporting to be able to answer:
- How many leads are generated each week by each channel?
- How much money is spent on each channel?
- How many of those leads proceed to subsequent stages in the funnel
(i.e. marketing qualified lead, sales qualified leads, deal etc). - What is the cost per sales qualified lead across each channel?
- Who visits the website, but does not convert?
- What is CEIPAL’s overall website conversion rate?
Given that CEIPAL is currently utilizing more than 9 different channels, a(m) had to account for all these data types. Luckily, we were able to access the source data from each channel platform and integrate it into one single database.
To achieve accuracy in the tracking, comparing, and reporting of the conversion data, we installed tracking code, assigned UTM parameters, and tested website behavior. After much analysis, testing, and tinkering, we arrived at a repeatable and reliable process – a proprietary report that gave CEIPAL the relevant KPIs for their weekly success.
It was only then, after mapping and tracking all activity to the website across all channels, were we finally able to report on performance and analyze results in order to make adjustments and improvements on marketing tactics. This herculean report was, is, and will continue to be put to use by CEIPAL to help them see where they’re making the biggest splash and getting the most bang for their buck.
You see, it’s not always about impressive metrics that show revenue increase or higher conversions. Sometimes, it’s just about staying organized, focused, and knowledgeable about return on investment across every step of a potential customer’s journey. By clearly identifying obstacles or shortcomings in the form of revenue loss or low ROI, they can easily be overcome with proper management. Whether it be a simple eCommerce product sale or a multi-step business-wide sell, tracking and reporting is critical to help any business set more realistic goals and monitor progress made toward them.
“Accelerate Media has been a huge asset to our team. Their strategic input has helped make us more successful and the care they put into creating custom solutions for our needs is something we are incredibly thankful for. ”
How We Measure Web Performance
When it comes to tracking and reporting, it can be hard to know where to begin when you have an overwhelming amount of data. Our process helps you prioritize your data to better measure your performance, so you only spend time on the metrics that matter. And we turn that raw data into rich insights, showing change on a weekly, monthly, and annual basis. We even take it one step further, scheduling next steps and actionable tasks based on those insights to ensure we are delivering continual results based on your desired outcomes.
Capture the Data to Discover the Story
Before the data gathering process starts, it’s important to define the key performance indicators that will need to be evaluated. What are you trying to achieve? What does success look like? The answers to these questions help us determine which data hold the source of truth for your business. After all, different visitors will land on your site for different reasons (and from different channels), and interact in a lot of different ways. Once we agree on our focus, we capture the relevant data and discover the true story of your web presence and current marketing efforts. This allows us to establish benchmarks so we can track progress moving forward and see which of our efforts are realizing the greatest success.
Uncover Insights & Take Action
We arm you with the data and insights you need to truly understand the progress being made. We don’t stop at telling you what has happened with your marketing; we’ll tell you what happened and why it happened, and we’ll help you understand why it matters and what it means going forward. After all, just because we see a change doesn’t mean it’s one that actually matters to your goals or what you’re trying to achieve. And we’ll only take action after we’ve thoroughly analyzed the “why”—either by shifting our strategies or doubling down on profitable efforts.